

Is your nonprofit positioned to secure more grants, or are you missing out?
In today's competitive funding landscape, knowing where grant money is flowing—and where it's not—could be the key to your success.
That’s why we’ve dug deep into the latest grant funding data across the US to bring you this Instrumentl Insights Report. You'll discover:
- How your state's grant success rates stack up against others
- Which regions are leading—and which are lagging—in securing grant funding
- The trends that could impact your future grant strategy
By the end of this article, you’ll have the data-driven insights you need to refine your approach—whether you’re looking to uncover new opportunities, target high-potential areas, or focus on well-funded counties.
Ready to stay ahead in the grant game? Let’s dive in!
.png)
Grant Funding in the U.S. - Is Your State Leading or Lagging?
Understanding where grant funding is concentrated is essential for shaping a successful grant-seeking strategy.
Below is a chart showing the concentration of grant award funding in 2022.

You can see that California is leading, with a concentration around New York, New Jersey, and Massachusetts. Flordia and Texas follow behind.
Let’s double-click into where most grant funding is awarded!
The Top 5 US States by Grant Funding

1. California: $33.7 billion
California leads the nation with an impressive $33.7 billion in grant funding. This state is a goldmine for nonprofits, especially those operating in Los Angeles County, which alone received over $9 billion in 2022. If your organization is based in California, there’s a strong local landscape to capitalize on. If you’re outside the state, California’s extensive funding opportunities might be worth exploring as part of your strategy.
2. New York: $27.7 billion
Coming in second, New York secured $27.7 billion in grant funding. New York County, including Manhattan, accounted for a substantial $17.6 billion total in 2022. For nonprofits in or near New York, this represents a significant opportunity. New York’s strong funding landscape should be on your radar if you want to expand your reach.
3. New Jersey: $18.7 billion
New Jersey's $18.7 billion in grant funding earned it the third spot on the list. A significant portion of this funding came from Somerset County, which received over $9 billion in 2022. Nonprofits operating in New Jersey might find particular success targeting well-funded areas like Somerset. If you’re considering expansion, New Jersey’s specific, high-funding regions could complement your current efforts.
4. Massachusetts: $14.2 billion
Massachusetts remains a consistent leader in grant funding, with $14.2 billion awarded in 2022. This state’s steady flow of grant money makes it an attractive option for nonprofits seeking stable, long-term funding. If your organization is based in Massachusetts, this reliability allows for strategic planning with confidence.
5. Florida: $13.9 billion
Florida rounds out the top five with $13.9 billion in grant funding. Miami-Dade County has the most funding, with almost $4 billion. The state’s overall growth suggests emerging opportunities. Florida’s rising funding landscape could be an area to explore for nonprofits looking to diversify their grant portfolios.
The Top 5 US Counties by Grant Funding
Understanding state-level trends is important, but county-level data reveals even more targeted opportunities.

1. New York County, NY: $17.7 Billion
Manhattan led the nation in grant funding in 2022, making it a prime target for nonprofits seeking substantial support. The concentration of funds here offers significant opportunities for grant-seeking nonprofits.
2. Los Angeles County, CA: $9.4 Billion
It’s probably no surprise that L.A. County is a central player in California’s grant landscape. Nonprofits in or looking to expand within this region should consider LA a focal point for their grant-seeking efforts.
3. Somerset County, NJ: $9.2 Billion
Over $9 billion was awarded in Somerset County in 2022, positioning it as a key area in New Jersey’s funding scene. Its proximity to New York City undoubtedly plays a role in this county’s access to grant funds.
4. King County, WA: $9.1 Billion
King County, Washington, lands at fourth place with $9.1 billion in grant funding, offering robust opportunities for nonprofits in the Pacific Northwest.
5. Suffolk County, MA: $7.3 Billion
Suffolk County rounds out the top five counties with just over $7 billion in grant funding.
For grant professionals, understanding where the money flows—both at the state and county level—is crucial for refining your grant-seeking strategy.
However, simply knowing where the money is isn’t enough; you need to craft a compelling proposal that resonates with the specific priorities of the funders in these regions.
Jacob B. Chase, CEO of Chase Consulting Solutions, emphasizes the importance of a tailored approach, especially in highly competitive or well-funded markets:
“Always tailor the proposal! Align your language with the funder’s goals and values to show that you understand their priorities.”
Whether you’re targeting the $33.7 billion in California or the $18.7 billion in New Jersey, a one-size-fits-all approach won’t work. Your proposals need to reflect a deep understanding of the local funding landscape and demonstrate how your nonprofit’s mission aligns with the funder’s objectives.
As Veronica Kulon, Grant Writer and Nonprofit Consultant, advises:
“Grants are highly competitive, with many organizations competing for the same funds. Tailor applications to highlight your organization’s unique strengths, seek ways to stand out, and clearly articulate the specific impact your project or program will have.”
Overall, you can use this data as a guide to reassess and sharpen your grant strategy. Focus on the regions where funding is abundant, but remember that a well-crafted, tailored proposal is your strongest asset in securing these vital grants.
Grant Funding Growth or Decline
Let’s look at how each state's year-over-year grant funding has changed between 2021 and 2022.

States With Significant Funding Growth From 2021 to 2022
Identifying states with rapid growth in grant funding can reveal emerging opportunities for nonprofits looking to expand their reach.
The following states experienced the highest year-over-year (YoY) growth in total award amounts from 2021 to 2022:

1. Delaware: 45.1% Growth
Delaware leads the way with a 45.1% increase in grant funding, positioning the state as a growing hotspot for nonprofits seeking funding.
2. Connecticut: 36.6% Growth
Connecticut’s 36.6% growth signals its rising potential as a lucrative target for nonprofits.
3. Montana: 35.7% Growth
Montana's 35.7% growth is also notable and indicates new funding opportunities.
4. Florida: 34.1% Growth
Florida continues to be a key player with a 34.1% increase in grant funding.
5. New Jersey: 29.3% Growth
New Jersey rounds out the list with nearly 30% growth, reinforcing its strong position in the grant landscape.
The rapid growth in grant funding across these five states presents unique opportunities for nonprofits, but success requires a strategic approach.
As Teresa Huff, a Nonprofit Grant Strategist, points out:
“Nonprofits often don’t do enough due diligence. It’s essential to understand the funder’s priorities and tailor your approach to align with their goals.”
Thorough research and alignment with funder expectations is crucial when targeting states with rapid growth.
Additionally, Julie Starr, Owner of Write Epic Grants, emphasizes this same importance:
“Funders want to see a clear connection between your proposal and their priorities, along with a demonstrated ability to deliver results.”
For nonprofits, these emerging opportunities are not just about chasing new funds but strategically positioning your organization for long-term success.
As funding landscapes shift, focusing on states with rapid growth can be a solid strategy. But remember: success depends on how well you tailor your proposals and communicate your organization’s unique value.
Which States Are Losing Grant Funding the Most?
While some states are experiencing significant growth in grant funding, others are seeing a decline. These insights are crucial for nonprofits operating in or expanding to these regions to consider.
Below are the states with the largest decreases in grant funding from 2021 to 2022.

1. Illinois: -47.6% Decline
Illinois has seen a dramatic 47.6% drop in grant funding, the largest decline among all states. Although it’s difficult to pin down exactly why this drop is so steep, economic factors related to COVID-19 funding may explain. In 2021, Illinois benefited from a significant influx of federal funding through relief measures such as the American Rescue Plan Act (ARPA) and the Coronavirus Aid, Relief, and Economic Security (CARES) Act. These programs provided a boost to state and local grant funding. However, these relief measures may have begun to taper off in 2022, showing a reduction in the available grant funds.
2. Pennsylvania: -11.4% Decline
Pennsylvania has experienced an 11.4% decrease in grant funding, indicating a notable downturn. Nonprofits in Pennsylvania may need to adjust their strategies by seeking additional funding sources or diversifying their efforts to include more stable or growing regions.
3. Mississippi: -9.7% Decline
Mississippi’s grant funding declined by 9.7%, suggesting a shrinking pool of resources for nonprofits in the state. Organizations operating in Mississippi might face increased competition for fewer funds, making it crucial to refine their grant applications or explore opportunities in other states with more stable funding.
4. Arkansas: -8.5% Decline
Arkansas saw an 8.5% decline in grant funding, reflecting a reduction in available resources. Nonprofits in Arkansas may need to reassess their funding strategies, considering both local opportunities and potential expansion into regions where funding is growing.
5. Maryland: -7.0% Decline
Maryland experienced a 7.2% decrease in grant funding, making it one of the states facing a resource reduction. Nonprofits in Maryland should be aware of this decline and may need to look for additional funding opportunities outside the state to offset the reduction.
With that being said, declining grant funding in these states doesn’t mean nonprofits should give up. Instead, it simply means they need to adapt to the changing landscape.
Here’s some great advice from Julie Starr:
“I have noticed that many nonprofits forget that grant funders are people. Even competitive grants have real people evaluating them. We should never forget to speak directly to them, infusing our passion into every sentence.”
When the competition is fierce, injecting passion into your proposal’s narrative, clearly articulating your mission and impact, and demonstrating how your organization aligns with the funder’s goals can make all the difference.
By adjusting your approach and emphasizing the human element in your applications, you can navigate these challenges and continue to secure the support your organization needs.
Securing larger grants can significantly boost your nonprofit’s ability to fund its programs, and individual grant sizes vary widely by state.
Here’s a comparison of the states offering the highest average grant sizes, highlighting where larger funding opportunities are available.

1. New Jersey: $169,818
New Jersey leads the nation with the highest average grant size.
2. Nebraska: $135,141
Nebraska offers the second-largest average grant size at $135,141.
3. Washington: $130,578
Washington ranks third with an average grant size of $130,578.
4. North Carolina: $117,604
North Carolina offers an average grant size of $117,604, making it another state with substantial funding per grant.
5. Georgia: $113,881
Georgia rounds out the top five with an average grant size of $113,881.
In highly competitive grant processes, you want to make sure that your proposal really stands out above all the others. This means it’s innovative, compelling, and free from errors.
Lauren Wiskerson, Fundraising Executive, shares how she does this:
“To make a grant stand out…highlighting the innovation and uniqueness of your approach is essential. Funders are on the lookout for projects that propose novel solutions to existing problems or tackle social issues in innovating ways. Detailing what makes your work exceptional involves showcasing specific aspects of your program that are not only different, but also more effective or efficient than conventional methods.”
It’s also crucial to demonstrate to funders the potential impact of your project, as well as your ability to execute it successfully. Funders need to feel confident that their financial investment will yield tangible outcomes in the community.
Lauren Wilkerson underscores this point:
“Grant writers should meticulously align their project outcomes with the funder’s intended impact, clearly showing that their initiative will significantly advance the funder’s objectives and yield substantial, measurable results.”
The states offering the largest average grants present significant opportunities, but competition is often fierce. To take full advantage, grant writers should be sure to fine tune their proposals by tailoring them to funder priorities, demonstrating innovation, and clearly outlining how the funding will be used to generate measurable impact.
Which States Have the Most Grants Available?
It makes sense to focus on states with the highest number of grant opportunities, as more available grants can increase the chances of securing funding—even if individual grant sizes are smaller.
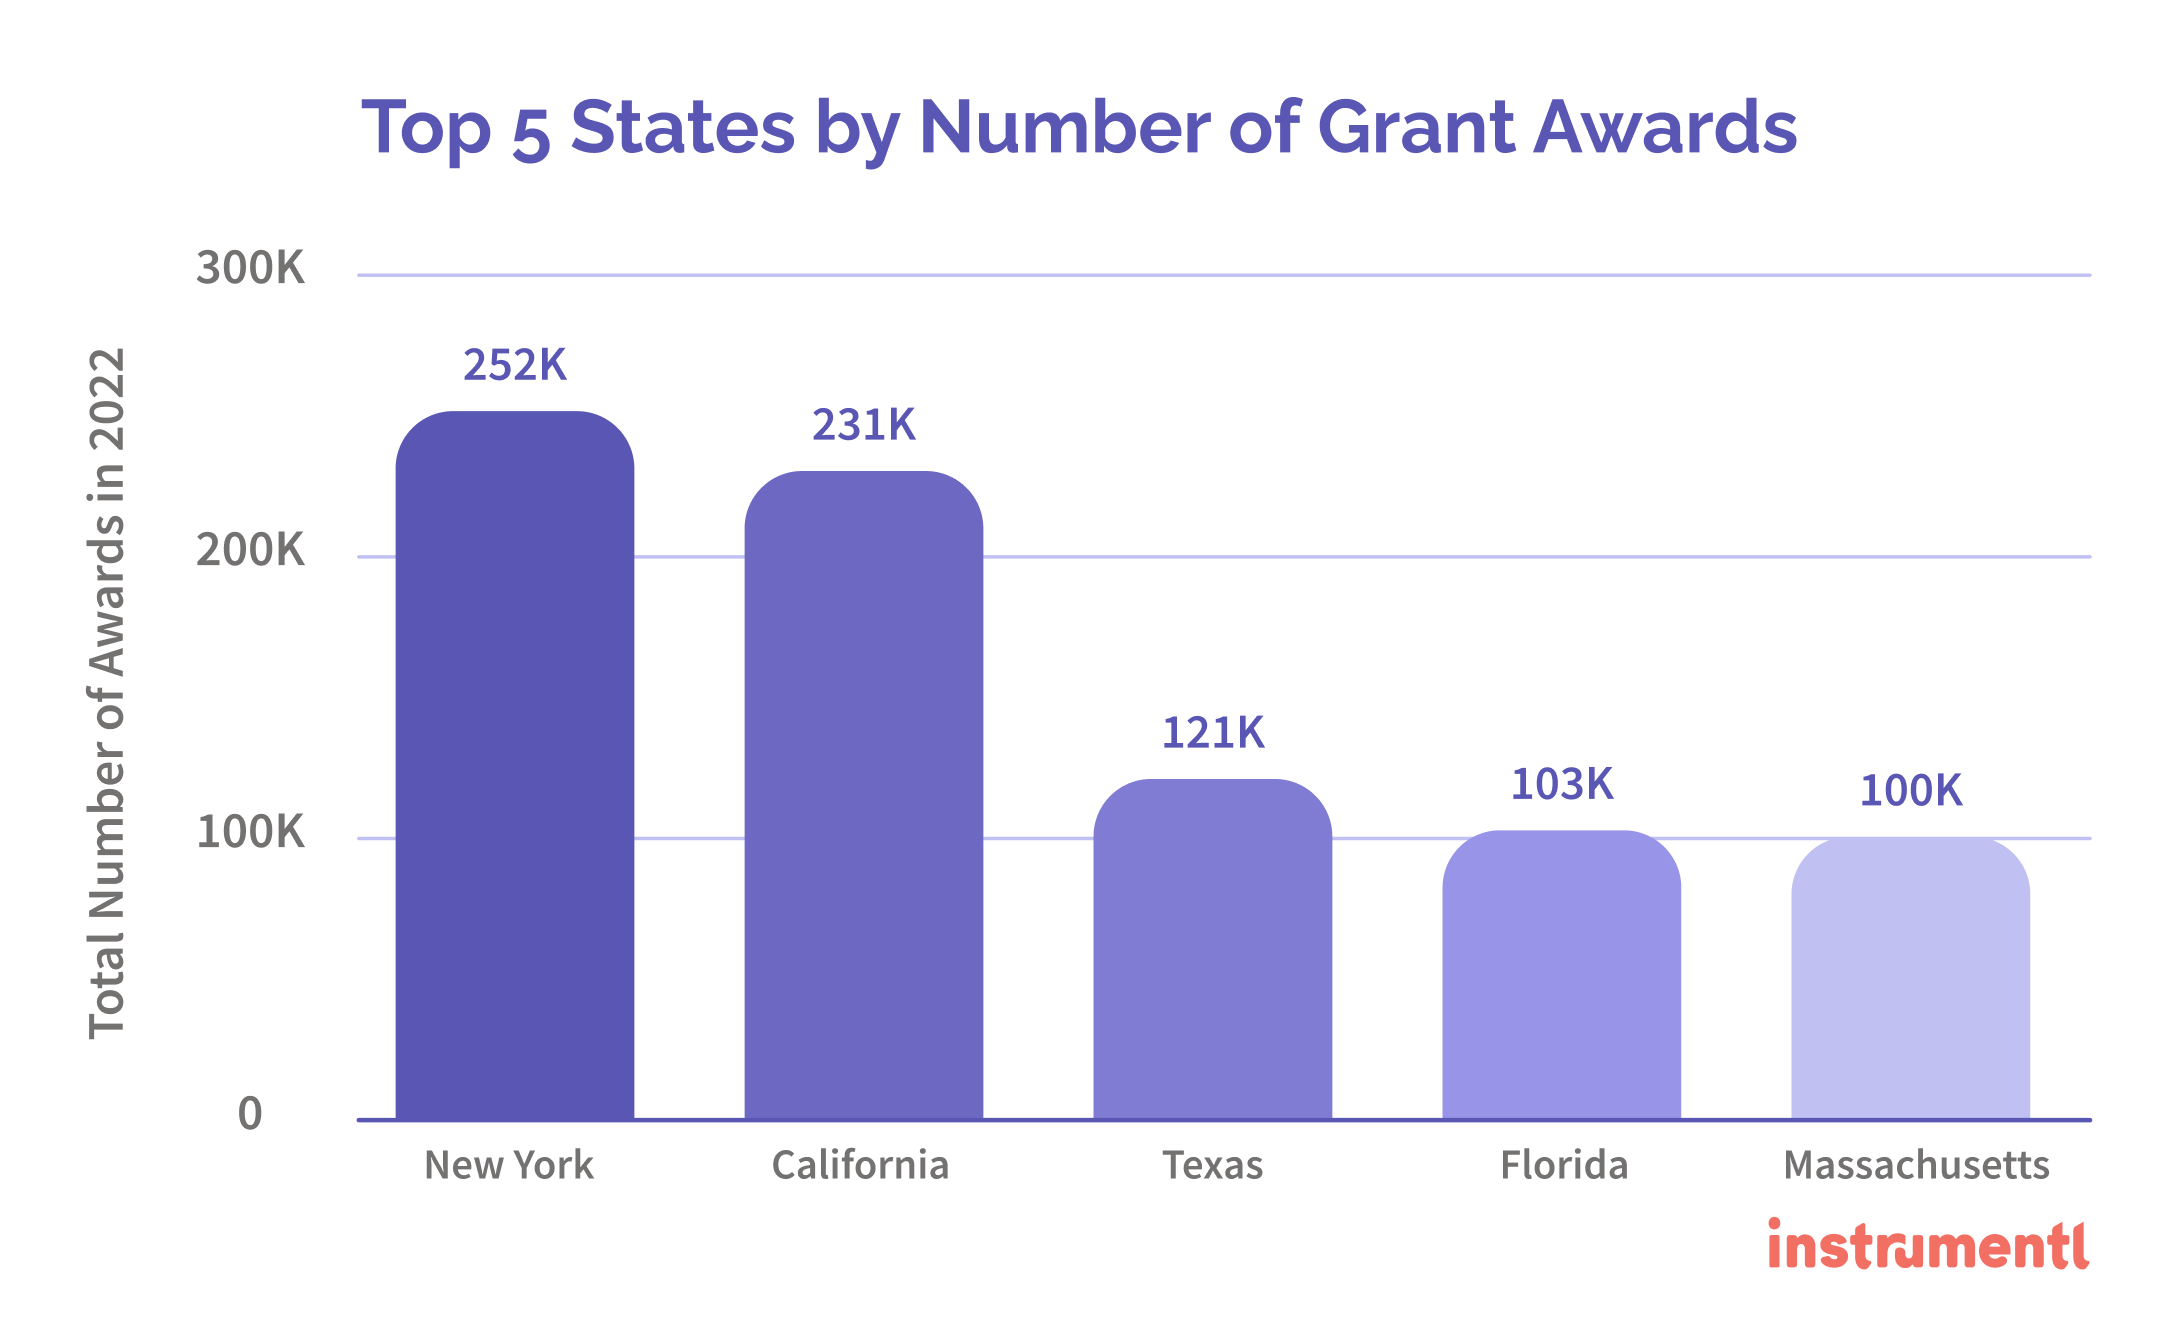
There's a clear correlation between the number of grants available and the total funding awarded. See the chart at the top for the top states.
1. New York: 252,052 Grants
Average Award Size: $84,119
2. California: 231,125 Grants
Average Award Size: $108,014
3. Texas: 121,052 Grants
Average Award Size: $95,862
4. Florida: 103,290 Grants
Average Award Size: $101,200
5. Massachusetts: 100,614 Grants
Average Award Size: $106,607
Comparing the average grant size with the number of grants awarded is interesting. You can see in the graph below which state has the largest average award size and the highest number of awards. This is from 2022.

Pro Tip: Just because there are more grants available doesn’t mean competition is any less fierce. Continue to tailor each proposal to the specific goals of each funder so that you can best leverage the sheer volume of opportunities to build a more robust funding portfolio.
How To Find Relevant Grant Funding in Your State
Finding the right grants for your nonprofit can be challenging, but Instrumentl makes it easier by matching you with relevant opportunities tailored to your cause and location.
- Access Instrumentl’s comprehensive grants database and filter grants by your location, type of funder, and giving category.
- Manage your entire grant pipeline by tracking your progress and setting reminders for deadlines to hit your funding goals.
Jan Spackman, Director of Grants at Sleep in Heavenly Peace, shares her experience using Instrumentl:
“We’ve been using Instrumentl for just over a year. We brought in about $2 million last year, which was up a million over the year before.”
Appendix: State Grant Funding (2021-2022)
Methodology
To provide a comprehensive view of the grant funding landscape across the United States, we analyzed data from Instrumentl’s extensive database of grant funding opportunities. Our focus was on year-over-year (YoY) trends between 2021 and 2022, highlighting significant changes in total funding amounts across different states.
Data Sources:
The data includes information from a wide variety of funders, ensuring a diverse and representative sample. The funder types covered in this analysis include, federal, private, community or state, corporate, and associations. This broad inclusion of funder types allows us to offer a holistic picture of the US grant funding landscape.
Analyzing the Location of Funding:
To determine the geographical distribution of funding, we based our analysis on the home state of the funders, as recorded in the Instrumentl database. It’s important to note that this introduces a limitation: while funders may be located in one state, they often award grants to organizations in other states. As a result, the funding totals presented for each state reflect where funders are headquartered rather than the exact location of the nonprofit recipients. This means that some states may appear to have higher or lower funding levels depending on the presence of large funders in that state.
Year-Over-Year Comparisons:
We tracked grant funding changes by comparing the total amount of funding awarded by each state’s funders in 2021 versus 2022. This YoY comparison allows us to highlight the states that are experiencing growth or decline in their grant funding landscape. For each state, we also calculated the percentage change in funding during this period to better understand the funding dynamics and trends.

