

When it comes to securing grants, nonprofits often ask: Which funders will give us the best shot at success? With numerous types of funders available—from private foundations to federal agencies—knowing where to focus your grant-seeking efforts can be challenging.
That’s why we analyzed data from Instrumentl to compare different types of funders, including private, corporate, state/local government, and federal funders, based on their:
- Success rates
- Average grant sizes
- Percentage of requested amounts awarded
Our goal with this Instrumentl Insight Report (and all our Insight Reports) is to give you a clear view of where to focus your efforts to target high-potential funders and improve your grant-seeking outcomes.
Let’s dive into the data.
Understanding the Current Funder Landscape
We wanted to see if certain funder types were more popular than others. We discovered that what’s popular isn’t always what’s most strategic.

When it comes to funders, private foundations are the clear favorite among nonprofits, making up 56% of saved searches on Instrumentl and receiving the majority of applications.
It makes sense—private funders are often seen as more accessible, with fewer hoops to jump through.
Federal funders also receive considerable attention, making up 21.4% of saved searches.
So, why are so many nonprofits focusing on these funders?
- Perception of accessibility: Private funders tend to have fewer regulatory requirements.
- Large Funding Pools: Federal grants can offer significant payouts, which can be appealing despite their complexity.
- Familiarity: Nonprofits may feel more comfortable applying to funders they’ve worked with before.
- Higher Visibility: Private and federal funders often have more marketing and recognition compared to lesser-known funders.
But by focusing so much on private and federal funders, nonprofits might be missing out on easier wins from state and local government grants or under-the-radar funders that offer higher success rates. It’s critical to do your research before investing time and energy into pursuing a funder.
Teresa Huff, Nonprofit Grant Strategist, shares:
“Nonprofits often don’t do enough due diligence on funders before applying.”
.png)
The data coming up should help you determine whether it’s time to adjust your strategy to pursue opportunities that could give you a better shot at securing funding.
The Funding Success Rates Across Different Funder Types

On average, nonprofits using Instrumentl to manage their grants see a 34% grant success rate across all funders.
Important Note: While this provides valuable insight into the types of funders nonprofits are most successful with, it’s important to note that this data is drawn from users on Instrumentl and may not fully reflect the broader grant-seeking landscape. Remember that many factors influence grant success rates. Success rates can be affected by the nonprofit’s experience, the complexity of the grant, and the organization’s ability to meet funder requirements. Funding For Good has a great article that unpacks the various factors that impact success rates, making it hard to have a “one size fits all” benchmark.
Here’s what Instrumentl’s data shows for different funder types:
- Private funders have a 30% success rate
- State and local government funders stand out with a 52% success rate, the highest across all categories.
- Corporate funders have a lower 22% success rate.
- Federal funders offer a 25% success rate.
- Association and society funders are similar to private ones with a 28% success rate.
Disparities in success rates between different types of funders may stem from several factors, including application complexity, competition levels, and the types of projects funders tend to support.
For example, state and local funders often prioritize community-based initiatives, which may align more closely with the types of projects many nonprofits pursue. On the other hand, corporate and federal funders, while offering larger grants, tend to be more competitive and have more stringent requirements, resulting in lower success rates.
Julie Starr, Owner of Write Epic Grants offers some advice to keep in mind, especially when targeting funders with lower success rates — like corporate or federal opportunities.
“I focus on a few key elements when applying for competitive grants: a compelling narrative, strong community need, and proven impact. These help position our organization as a strong candidate.”
.png)
Actionable Insight: View success rates as indicators, not guarantees. Evaluate your capacity and fit with a funder rather than relying solely on success rate data. While Instrumentl’s data offers valuable insights into current trends, factors like the complexity of grant applications and your nonprofit’s experience should be considered when formulating a grant-seeking strategy.
Let’s look at average and median grant sizes from different funders.
- Large-Scale Projects: Federal and state/local government funders are best suited for large-scale projects, given their higher average award sizes. However, nonprofits should adjust expectations based on the median sizes, as most awards will not be in the millions.
- Focused Projects: Private, corporate, and association/society funders are more likely to provide more cause-focused grants, making them ideal for nonprofits looking to secure multiple awards to fund more specific initiatives.
Matching Ask Amounts With What Funders Actually Award

When making a grant request, have realistic expectations about how much of the requested amount will be awarded.
Review our guide to determining a funder’s average grant size so you don’t ask for too much and risk being rejected.
The graph above shows what percentage of the requested amount funders actually award:
- State/Local Government: These funders award about 50% of the requested amounts, making them a strong choice for local-based nonprofits.
- Corporate Funders: On the lower end of the spectrum, corporate funders only award 11% of the total amount requested.
- Federal Funders: Federal funders award 15% of requested amounts, similar to corporate funders. Despite a better success rate, they’re not the best option if you’re expecting to get close to your ask.
- Private Funders: Private funders typically award around 25-26% of requested amounts, offering a more moderate return compared to other funder types.
- Association and Society Funders: These funders are similar to private funders, awarding about 28% of requested amounts.
Where Nonprofits Should Focus Their Grant-Seeking Efforts
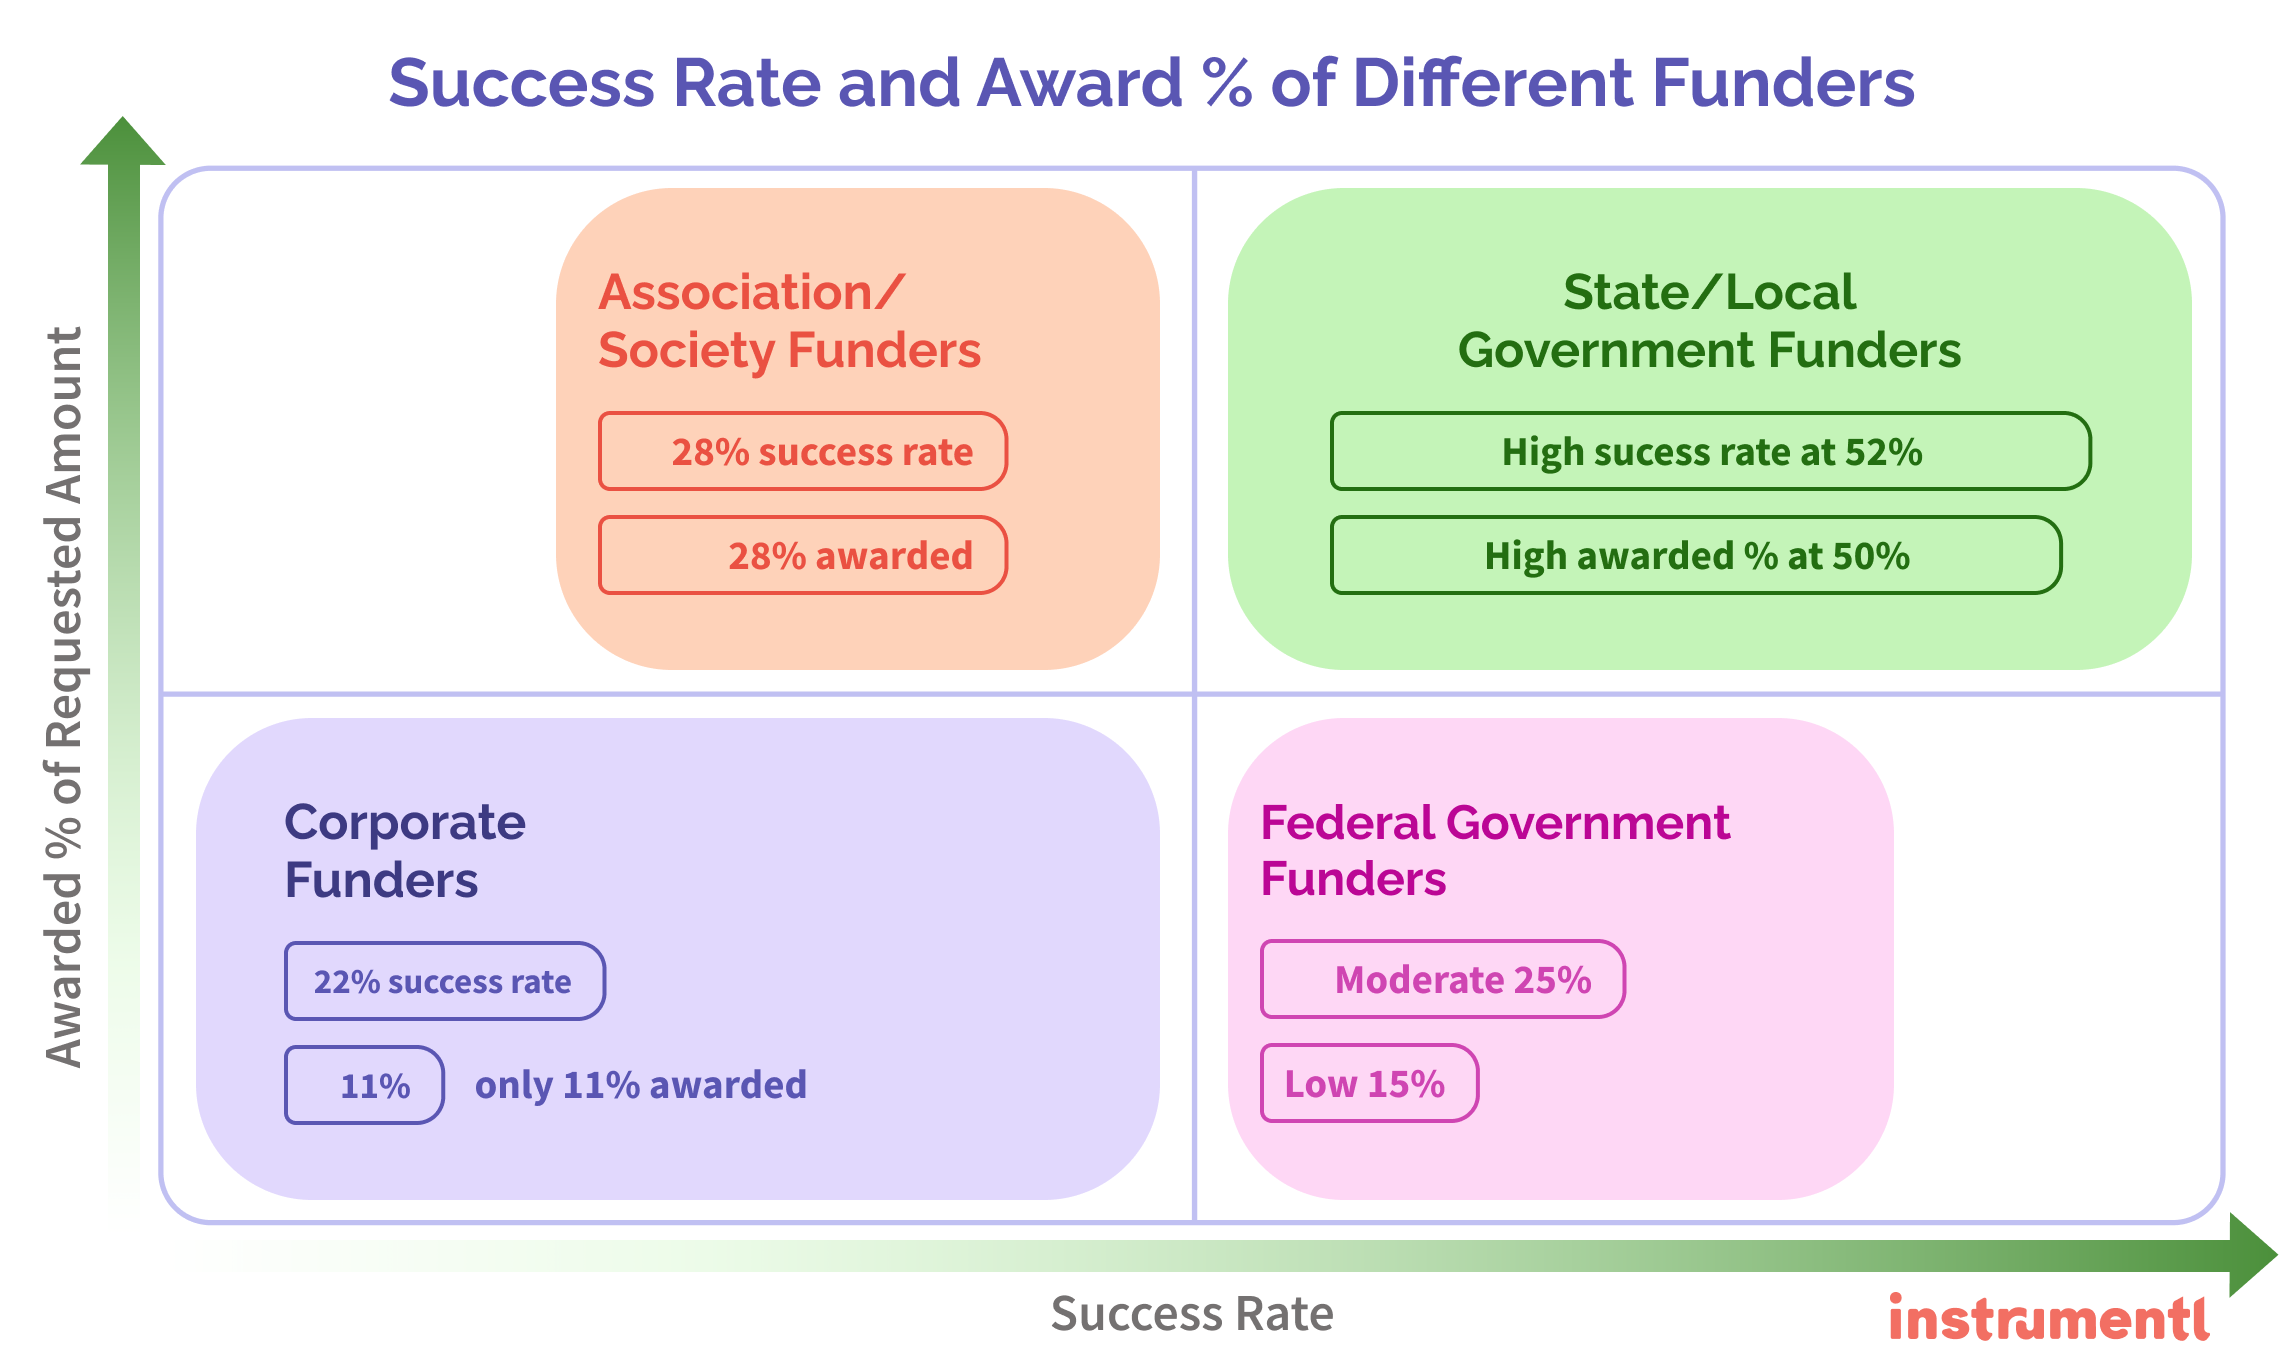
Below, we break down different funders' success rates and payout percentages. The data provides insights into different types of funders—each with its own strengths and limitations.

State/Local Government Funders: A Strong Option for Community-Based Projects
State and local government funders stand out with a 52% success rate and tend to award 50% of the requested amounts, making them a strong choice for nonprofits focused on community-based projects.
- These grants are often aligned with local priorities, such as public policy or regional initiatives, making them a more strategic option for nonprofits operating on a smaller geographic scale.
- However, national organizations or those with a broader scope may find fewer relevant opportunities from these funders.
While the high success rates are appealing, nonprofits should carefully consider whether their project goals align with these funders’ objectives before investing significant time in the application process.
Associations/Society Funders: Untapped Opportunities
Association and society funders are often overlooked, offering a 28% success rate and awarding 28% of requested amounts. Many nonprofits miss these opportunities because they tend to be smaller or seem less familiar.
However, the lower competition can work in your favor, and these grants are often more accessible for nonprofits willing to explore them.
Private and Federal Funders: Popular But Competitive
Private and federal funders are popular targets for many nonprofits due to their large funding pools. However, these opportunities come with notable challenges.
- Federal grants, for instance, offer only a 25% success rate and award around 15% of requested amounts.
- Private funders have a 30% success rate and typically award around 32% of requested amounts.
Actionable Insight: While federal grants are often best suited for large-scale, national projects, they carry a higher administrative burden, making them a better fit for nonprofits with established infrastructure and the capacity to manage complex grants. Nonprofits should carefully weigh the time and resources needed to apply for these grants against the potential return.
Corporate Funders: Lower Success and Payout Rates
Corporate funders present the most challenging landscape with the lowest success rates and awarding only 11% of requested amounts.
Consider corporate funders as a supplement to your primary funding sources. They may be more suitable for highly specific projects. Corporate funders usually have specific causes they want to support. For this reason, align your goals with theirs.
Lauren Wiskerson, Fundraising Executive, shares this advice:
“A frequent oversight in grant applications is the failure to effectively illustrate how a project’s impact aligns with a funder’s goals. Demonstrating a deep understanding of the funder’s priorities and showing a clear connection between these goals and your program’s objectives is crucial.”
Below is a bubble chart that compares the three elements we've looked at in this article across different funders:
- Their success rate (x-axis)
- The amount funders usually award as a percentage of what nonprofits request (y-axis)
- Their average grant size (bubble size)

Practical Steps for Prioritizing the Right Funders
We know that to successfully scale up, you have to focus on the right funders—those who align with your organization’s needs and goals.
Here are a few practical steps to boost your success rates.
Analyze Your Grant Portfolio
Start by evaluating your current grant portfolio. Are you too reliant on federal, corporate, or private funders, which may award a smaller percentage of what you request? Consider whether it’s time to shift focus or diversify your efforts to funders with a higher alignment to your organization’s projects.
Tailor Your Grant Applications
Look at the data on average grant sizes and awarded percentages, and match your request to those figures to improve your chances of getting funded.
Jacob B. Chase, CEO of Chase Consulting Services, advises:
“Always tailor the proposal! Align your language with the funder’s goals and values to show that you understand their priorities.”
Diversify Your Funding Sources
If your nonprofit has been focused too heavily on a single type of funder, it might be time to diversify. State/local government and association funders often come with higher success rates and better payout percentages.
However, these funders may be more suitable for local or community-based projects. For national nonprofits, private and federal funders might be a better fit, despite their lower success rates.
While some state and local grants can be harder to find, Instrumentl offers tools to help you manage and report on any grant—even those sourced outside the platform. If you need to search for additional opportunities beyond Instrumentl, you can easily upload those opportunities and include them in your workflow.
Final Thoughts on Which Funders To Pursue
This report seeks to provide valuable insights into winning grants from different types of funders, but your nonprofit should approach it with a balanced perspective.
While focusing on the right funders can significantly boost your chances of securing funding, general success rates alone don’t tell the full story. Risk assessments should be key factors in your decision-making process, including the time, cost, and complexity of applying for and managing grants.
Important Note: The data in this report is specific to Instrumentl users’ performance and may not fully reflect industry-wide trends. View it as one indicator to guide your grant strategy, not a one-size-fits-all benchmark.
To start finding better-fit grants faster, get started with Instrumentl. Identify and target the funders that align with your nonprofit’s needs — and those with higher success rates, better payout percentages, and more realistic grant sizes.
Methodology
To analyze which types of funders are most often associated with successful grant applications, we collected and analyzed data from Instrumentl’s platform between 2021 and 2023. This data was sourced from grant applications tracked by nonprofits using Instrumentl’s tools. Our goal was to help nonprofits better understand where to focus their grant-seeking efforts by identifying the funders that awarded the most grants and highest amounts.
Data Collection
The specific insights we aimed to gather included:
- The number of grants awarded to different funder types.
- The total dollar amount awarded from each funder type.
- The success rates for each funder type, defined as the percentage of submitted grants that were awarded.
- The average and median grant sizes for each funder type to provide additional context on the size of grants typically awarded.
To break down this data, we grouped the funders into five categories:
- Association/Society
- Corporate
- Federal Government
- Private
- State/Local Government
Amount of Dollars Awarded vs. Submitted
We also looked at the ratio of grant dollars requested by nonprofits compared to what was ultimately awarded. This allowed us to determine the percentage of requested amounts that were granted by each funder type. This insight is particularly useful in helping nonprofits manage expectations and tailor their grant requests more effectively.
Limitations
It is important to note that the data collected is specific to Instrumentl’s platform and may not fully reflect the broader grant-seeking landscape. The insights gathered from this data should be viewed as indicators, not definitive benchmarks, and nonprofits should consider their own unique circumstances, capacity, and alignment with funder priorities when interpreting these results.

