

California is the most populated state, with over 38 million people calling it home.
Our team has reviewed public IRS 990 Forms submitted between 2021 and part of 2023 by nonprofits in California.
Throughout this report, we hope to provide a detailed analysis of private funding trends in California, looking at:
- Total private funding
- Top private funders
- Top private grantees
- The distribution of grant funding among counties
We’ll also share insights from nonprofit leaders in California who have weighed in to help you develop your strategies in private giving.
Likewise, if you want the full report, not just the top highlights, download the source data below:
.png)
Private Funding in California – Year-Over-Year Comparison From 2021 to 2023
Let’s explore the complete private funding landscape in California over the last three years.

Note that the IRS hasn’t yet released all the 2023 data. We estimate the total amount will rebound once the full data is available, so we’re estimating it to be around $37-39 billion.
What we know now is that California has consistently offered more than $30 billion in total funding since 2021. To see how that translates to nonprofits, let’s examine the median and average grant size.
The median grant size across all three years is relatively stable at around $10,000. That suggests consistent funding practices from private funders, which is a great sign.
If nonprofits maintain eligibility and foster positive relationships, they may be able to count on consistent funding of $10,000 or more from private funders.

The average grant size tells a slightly different story, and that’s because there are funder outliers who award multi-million dollar grants. This can skew the grant size to be larger than the median.
Once the complete 990 data set is released, the average grant award is also expected to remain relatively stable, between $160,000 and $170,000. Again, this stability suggests consistent funding practices year over year.

Top Private Funders Located in California
According to 990 data of funders in California, the top funders are university-affiliated foundations and community foundations.

It’s no surprise that the top private funders are universities. There are several big names with massive endowments.
But what are other private funders giving?
The next biggest concentration of giving is within healthcare and local giving.
Several large funders also support national and international efforts that advance the public good, in addition to those locally in California.
Much like the top private funders, this list reflects an emphasis on university research and health-related causes.
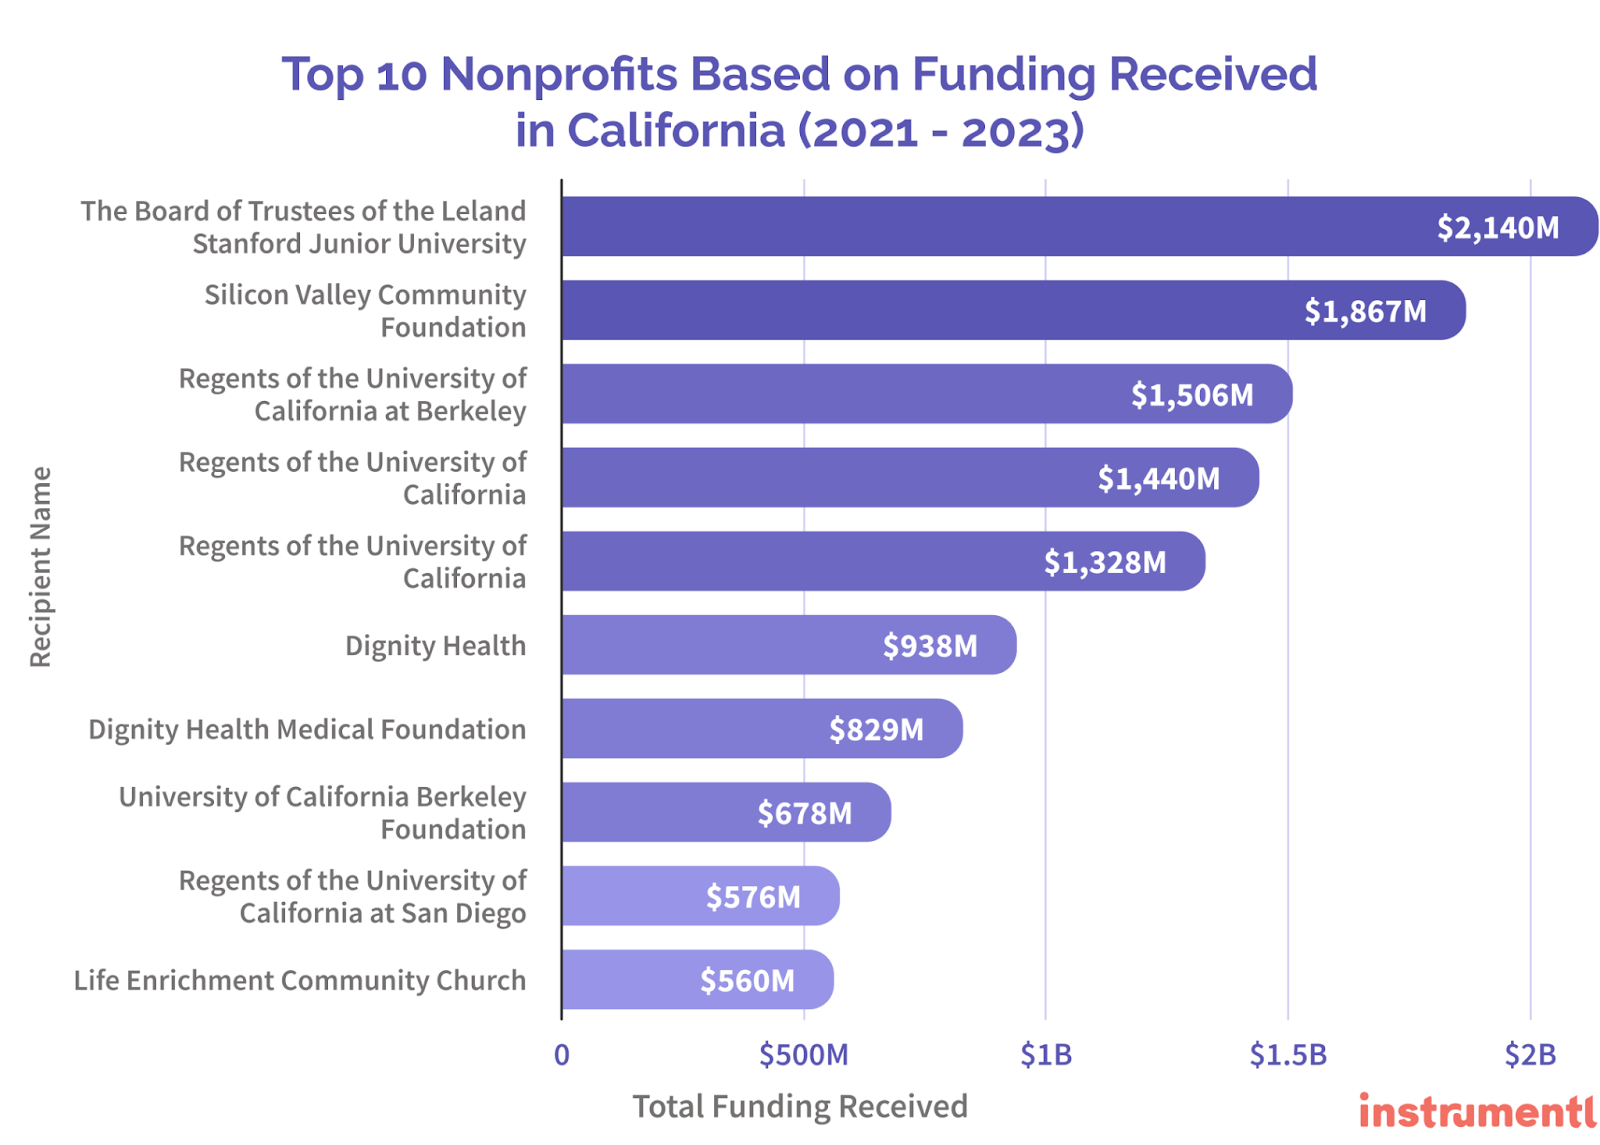
When you set aside the university funding and dig deeper into the missions of the top private grantees, you can see that funders are placing a strong emphasis on local, national, and global healthcare issues. The funds are largely intended to provide equitable access to health care.
There is one outlier in this list of top nonprofits receiving private funding in California. Life Enrichment Community Church has received support from funders across the United States to further its work addressing critical community needs. This can include healthcare access, but it is not its primary focus. Additionally, while it is a religious institution, it does not appear to only invest in religiously motivated efforts.
Top Counties in California Based on Nonprofit Funding
California has 58 counties. Urban counties like Los Angeles, San Francisco, and Santa Clara receive the majority of grants. Why? As you might expect, the amount of grant funding in each county is proportional to their population. Counties with higher populations have a greater concentration of funding.
The below heat map shows the density of grant funding among counties between 2021 and part of 2023.

Below, we’ve summarized the highest and lowest-performing counties and some notable outliers. See the “Appendix” section below for the full data.
Top performing counties by total grant funding awarded
- Los Angeles County stands as the top recipient with over $22.8 billion in total grant funding.
- San Francisco County and San Mateo County follow closely, receiving approximately $12.5 billion and $10.3 billion respectively.
Counties with the highest per capita grant funding
- San Francisco County has the highest grant funding per capita at $15,475.
- San Mateo County and Marin County also report high per capita figures at $14,260 and $8,621 respectively.
Counties with the most grants awarded
- Los Angeles County is again at the forefront, with 206,556 grants awarded between 2021 and 2023.
- San Francisco County and Alameda County follow, with 57,730 and 52,533 grants awarded, highlighting their strong grant-writing efforts and successful funding applications.
Underperforming counties by total grant funding awarded
- Glenn County, Alpine County, Colusa County, Sierra County, and Modoc County report the lowest total funding, each receiving less than $2.5 million over the period.
Counties with the lowest per capita grant funding
- Glenn County presents the lowest per capita funding at just $21 per resident, followed by Colusa County at $67 and Imperial County at $148.
Counties with the fewest grants awarded
- Alpine County (41 grants) and Colusa County (48 grants) had the fewest grants awarded, indicating potential barriers to grant access or fewer opportunities pursued.
- Sierra County, Glenn County, and Modoc County also have low counts, further emphasizing the need for targeted support in these regions.
Notable outliers
- High Per Capita Funding: Counties like San Francisco County, San Mateo County, and Marin County stand out for their substantial per capita funding, signaling exceptional grant acquisition relative to their population.
- Low Median Grant Sizes: Outliers with particularly low median grant sizes include Yuba County ($1,500) and Glenn County ($2,302).
Expert Advice to Navigate California's Grant Landscape
We’ve consulted with a few California nonprofits to get their take on the California grant funding landscape. Here’s what they shared.
Do What You Can to Open Doors
Joan Ford, Founder of Joan Ford Fundraising, has noticed a marked shift. An influx of nonprofits opening in Southern California and a generational change in the approach to funding are shrinking the funding pool.
“The bombarded funders are trying to find ways to screen and be fair to nonprofits, which means it is getting harder to get money. I know numerous high-quality, culturally responsive nonprofits with excellent leaders that are getting overlooked. Somewhere, the funding is not reaching the people who could really make a difference.”
To work to confront these challenges, Joan serves her clients in creative ways. When competition rises, she leverages connections, conducting site visits and utilizing their board of directors.
“We ask each board member if they have a connection to any of these nonprofits and their boards. I gather intel on prospects so we can try to find a way in the closed doors. We are having success, and it is working, but it takes more time to research, find a connection, and be allowed to apply.”
Joan used resources like Instrumentl to help her find funding opportunities faster. Instrumentl’s smart matching feature connected her to best-fit opportunities, relevant research, and potential connections. Together, these features allowed her to prospect faster and win more grants in the competitive environment.
Emphasize Outcomes
Holly Devi Alsop, Funding Strategist at One Click Grants, also recognizes that California's grant landscape has become more competitive. There’s an increase in need, as well as the number of applications each funder receives.
“Private grant funding in California has evolved to focus on equity and community-driven solutions. All funders emphasize accountability and transparency, making it critical for us to showcase how the nonprofit will monitor and measure outcomes.”
Less Can Be More
Peter Baxter, President and Co-Founder of Slamdance Group, has shifted their efforts to focus on private funding. They’ve streamlined their efforts, understanding less can mean more.
“We’ve focused our efforts on spending more time with fewer potential funders. That’s resulted in greater relationship building and helped us raise more money than before.”
That emphasis has allowed Peter to be more successful than they ever have been before.
Key Takeaways
As we reviewed the private funding landscape in California, we found the following:
- Private funding totals appeared lower in 2023, but that’s just due to IRS data delays. We expect the levels to be similar to those in previous years.
- Universities and large healthcare institutions continue to dominate the grantee landscape.
- Funding remains concentrated in major urban counties, but there are some smaller regions with larger grants.
- Grants by county are generally proportional to their population size.
Our experts are noticing an increase in nonprofits in California, causing an influx of grant applications. The general funding amount has remained stable, so the funding landscape is becoming more competitive. We recommend staying agile and preparing for possible shifts as the complete 2023 data becomes available.
You can start browsing California grants for free today in our grants database!
When you’re ready to explore our full suite of tools, you can sign up for a free 14-day trial. Check us out to see why Instrumentl is the best choice for California nonprofits looking to win more grants.
Appendix
Below is some of the data we’ve analyzed. For the full source data, download it below.
Grant Funding From Funders in California (2021 - partial 2023)
Top Counties in California (2021 - partial 2023)
Methodology
Our analysis of the private grant funding landscape in California from 2021 through part of 2023 was conducted using data sourced from Instrumentl’s grant database. Our database collects information from nonprofit 990 forms submitted to the IRS.
Data Collection: The core of our dataset comprised IRS 990 filings by nonprofits operating in California. These forms detail financial and grant-specific data, including total funding received, the number of grants awarded, and detailed grant amounts.
Time Frame: The analysis covered submissions from January 2021 to October 2023. While full data for 2023 is pending, the partial data available was deemed sufficient for trend analysis and preliminary conclusions.
Geographic Focus: We examined all 58 counties in California and the top grantors/grantees within California.
Key Metrics: Our insights draw from various metrics, including total number of grants awarded and their amounts, the number of grants received, and funding proportions in relation to county population sizes. We also looked at median and average grant sizes.
Limitations: The 2023 data set is incomplete due to the timing of IRS releases. While estimates have been included based on historical trends, complete insights for this year will only be finalized once all submissions are available.

